
What aquaculture engineers need to understand about photon flux density below the surface
Designing effective subsurface lighting for offshore aquaculture installations requires more than selecting a lantern with a high lumen output. The physics of light transmission through seawater are complex, and engineers who overlook them risk deploying systems that fail to deliver adequate illumination where it is needed most. This article builds a working understanding of photon flux density from first principles, then applies that understanding to the practical challenges of cage and pen design, spectral management, and remote monitoring integration.
The sections that follow move deliberately from foundational concepts to operational application. Whether you are specifying a new installation or auditing an existing system, the framework presented here will help you make better-informed decisions about subsurface aquaculture lighting.
What is photon flux density and how is it measured underwater?
Photon flux density describes the number of photons passing through a unit area per unit of time. In aquaculture and photobiological contexts, this is most commonly expressed as photosynthetic photon flux density (PPFD), measured in micromoles of photons per square metre per second (µmol m⁻² s⁻¹). This metric is distinct from illuminance, which is measured in lux and weighted to human visual perception. For fish physiology and underwater light management, PPFD is the more operationally relevant unit because it describes the actual photon energy available at a given depth.
Measuring PPFD underwater requires a quantum sensor, also called a PAR (photosynthetically active radiation) sensor, calibrated for the 400 to 700 nanometre wavelength range. These sensors are typically deployed at fixed depths within the cage or pen, and readings are taken at multiple points across the horizontal plane to build a spatial map of light distribution. A single point measurement at the centre of a pen is rarely sufficient, since light intensity varies significantly with distance from the source and with the geometry of the installation.
For example, a marine LED lantern positioned at the surface of a cage may register 500 µmol m⁻² s⁻¹ directly below the fixture at one metre depth. At five metres, that same source may deliver fewer than 50 µmol m⁻² s⁻¹, depending on water turbidity and the optical characteristics of the lantern. Understanding this relationship between source output and received flux is the starting point for any credible subsurface lighting design.
How water attenuates light as depth increases
Building on the measurement principles established above, the next step is understanding why photon flux density decreases with depth. Water attenuates light through two primary mechanisms: absorption and scattering. Absorption converts photon energy into heat, permanently removing those photons from the light field. Scattering redirects photons away from their original path without destroying them, but effectively reduces the directional intensity reaching any given point.
The rate at which these mechanisms reduce light intensity is described by the diffuse attenuation coefficient, commonly written as Kd. This coefficient varies with water type, suspended particulate matter, dissolved organic compounds, and chlorophyll concentration. In clear oceanic water, Kd may be as low as 0.03 m⁻¹, meaning light intensity decreases relatively slowly with depth. In coastal or turbid near-shore waters typical of many aquaculture sites, Kd values of 0.2 to 0.5 m⁻¹ are common, producing far more rapid attenuation.
A practical way to think about this: in clear water, a light source may retain roughly 70 percent of its surface intensity at ten metres depth. In turbid coastal water with a Kd of 0.4 m⁻¹, that same source may retain less than 20 percent at the same depth. This difference has direct consequences for how many fixtures are required, at what depths they must be positioned, and what output levels they need to deliver to meet target PPFD thresholds throughout the water column.
Why spectral composition shifts matter for offshore farms
Water does not attenuate all wavelengths equally. Red wavelengths (approximately 620 to 700 nm) are absorbed rapidly, with significant attenuation occurring within the first few metres. Blue and green wavelengths (approximately 450 to 550 nm) penetrate considerably deeper, which is why the ocean appears blue at depth. This selective absorption means that the spectral composition of light changes as depth increases, even when the total photon flux is still measurable.
For offshore fish farms, spectral composition matters for two distinct reasons. First, fish visual systems and circadian rhythms respond to specific wavelength ranges. Species such as Atlantic salmon are particularly sensitive to blue-green light, and their photoperiod responses, which govern growth rates and sexual maturation, are driven by photoreceptors that respond to wavelengths in the 450 to 500 nm range. A lighting system that delivers adequate total PPFD but is spectrally deficient in those wavelengths may fail to achieve the intended biological effect.
Second, spectral shifts affect how engineers should interpret PPFD measurements taken at depth. A sensor reading of 20 µmol m⁻² s⁻¹ at fifteen metres in a system dominated by red-shifted LEDs carries different biological implications than the same reading in a system with a blue-green dominant spectrum. This is a common point of confusion: total photon count and spectrally weighted photon count are not interchangeable when the objective is influencing fish physiology rather than simply providing illumination.
Applying flux density calculations to cage and pen design
With attenuation coefficients and spectral behaviour established, aquaculture engineers can apply flux density calculations directly to cage and pen geometry. The core design objective is to define a minimum PPFD threshold at the deepest point of the pen where biological effect is required, then work backwards to determine source output, fixture placement, and depth positioning. This is the inverse of how many installations are currently specified, where a fixture is selected based on surface-level performance data and depth coverage is assumed rather than calculated.
Defining the target PPFD envelope
The target PPFD threshold depends on the species being farmed and the specific biological objective. For photoperiod manipulation in salmonid species, industry experience suggests that minimum thresholds in the range of 1 to 10 µmol m⁻² s⁻¹ at the deepest occupied depth are commonly targeted, though the exact value should be determined in consultation with fish health specialists and informed by the specific production system. The key point for engineers is that this threshold must be defined before fixture selection begins, not after.
Modelling flux distribution across the pen
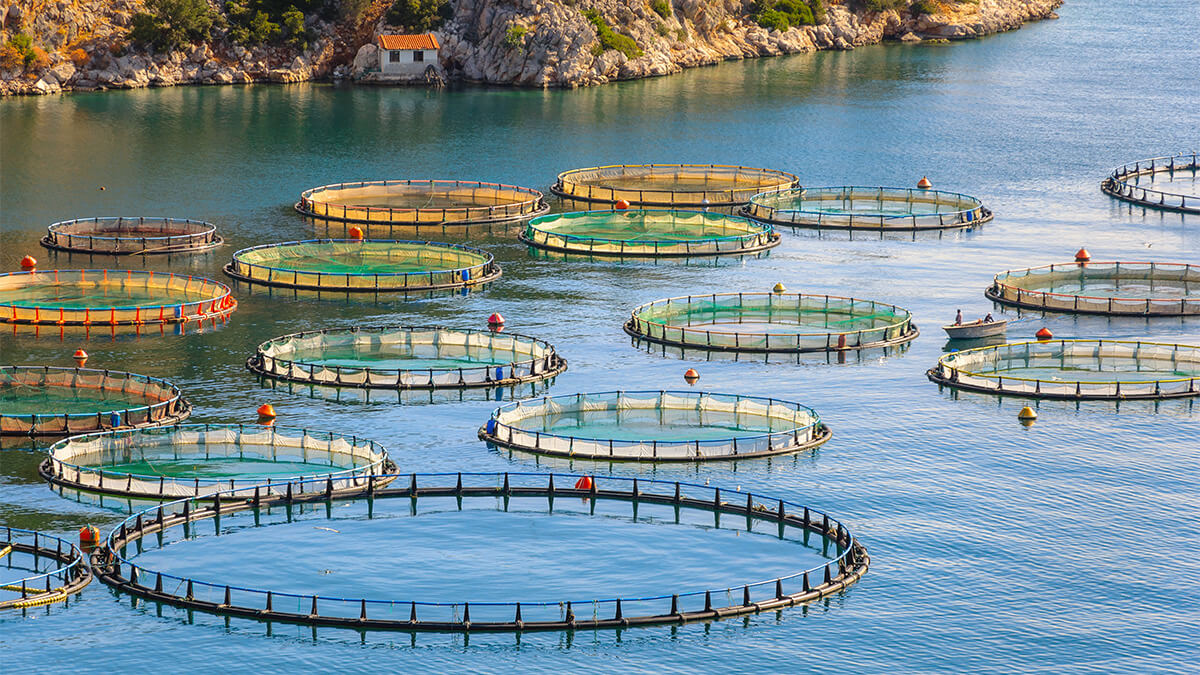
Once the target threshold is established, engineers can model the flux distribution using the Kd value for the installation site and the known output characteristics of candidate fixtures. For a cylindrical pen with a diameter of 120 metres and a depth of 25 metres, a single centrally positioned subsurface fixture is unlikely to deliver uniform PPFD across the full volume. Multiple fixtures positioned at intermediate depths and distributed radially will typically be required to achieve the target envelope without creating zones of excessive intensity near the source or deficiency at the periphery.
The analogy here is useful: designing subsurface PPFD distribution is similar to designing illuminance uniformity in an indoor facility. The ratio of maximum to minimum intensity across the target area, often called the uniformity ratio, is a critical design parameter. A uniformity ratio above 10:1 within a pen may cause behavioural stratification in the fish population, with stock concentrating in high-intensity zones and avoiding others.
Common flux distribution errors in subsurface lighting systems
Several recurring errors appear in subsurface aquaculture lighting installations, and understanding them is as important as understanding the underlying physics. The most frequent is over-reliance on surface-level or near-surface lux measurements as a proxy for subsurface PPFD. Lux readings taken at the water surface or just below it tell engineers very little about the light field at ten or twenty metres depth, particularly in turbid water where attenuation is non-linear and highly site-specific.
A second common error is failing to account for biofouling on fixture housings. Algae and marine growth accumulate on lens surfaces over time, progressively reducing effective output. A fixture specified to deliver 300 µmol m⁻² s⁻¹ at depth may deliver significantly less within months of deployment if the lens surface is not maintained or if the fixture design does not include anti-fouling measures. Engineers should build a biofouling degradation factor into flux calculations and select fixtures whose optical components can be cleaned or replaced without full system removal.
The third error is treating all fixtures as point sources when they are not. Many marine LED lanterns used in aquaculture applications have directional or partially directional emission patterns. Applying point-source inverse square law calculations to a directional fixture will produce inaccurate flux predictions, particularly at angles away from the primary beam axis. Fixture photometric data, including polar intensity distributions, should be used in place of simplified point-source models wherever it is available.
- Over-reliance on surface lux readings as a substitute for subsurface PPFD measurements
- Failing to model biofouling-related output degradation over the service life of the installation
- Applying point-source calculations to directional or semi-directional fixtures
- Ignoring site-specific Kd values and using generic attenuation coefficients instead
- Specifying total PPFD without accounting for spectral composition at depth
Integrating flux density data into remote monitoring frameworks
The final step in a rigorous aquaculture lighting design is closing the loop between calculated flux performance and real operational conditions. Subsurface PPFD values change continuously as water turbidity fluctuates with tides, weather events, and biological activity. A system that delivers adequate flux in calm, clear conditions may fall below threshold during a storm-driven turbidity event. Remote monitoring frameworks that capture both fixture output status and in-situ PPFD sensor data enable engineers to detect these conditions and respond before they affect production outcomes.
Modern remote monitoring solutions, such as the LightGuard Monitor used with Sabik’s marine lantern range, provide real-time visibility into fixture operational status, battery levels, and alarm conditions through a web-based interface accessible on any device. When integrated with PPFD sensor data logged at depth, this creates a complete picture of actual light delivery across the pen, not just the operational status of the fixture itself. The distinction is important: a functioning fixture does not guarantee adequate subsurface flux, particularly when water conditions change.
For offshore farms operating at significant distances from shore, the ability to monitor and respond to flux delivery issues without deploying a service vessel has direct operational and financial value. Engineers specifying new installations should design the monitoring architecture alongside the lighting system, not as an afterthought. Sensor placement, data logging intervals, and alarm thresholds for PPFD deviation should all be defined at the design stage, informed by the flux distribution models and species-specific thresholds established earlier in the process.
Sabik’s aquaculture lighting solutions are designed for exactly these demanding offshore conditions, with fixture architectures that support integration into remote monitoring frameworks and optical specifications that provide the photometric data engineers need for accurate flux modelling. For offshore installations where performance must be verified rather than assumed, the combination of rigorous flux calculation and real-time monitoring is the only reliable approach.
Contact Sabik’s technical team to discuss photon flux density requirements for your aquaculture installation and to request photometric data for fixture selection.